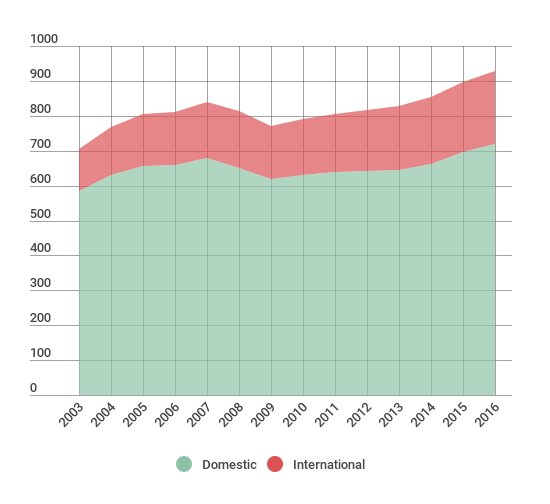
Total passengers travelling to and from the US hit a new record last year, according to figures released by the US Department of Transportation.
US and overseas airlines serving the country carried 928.9 million (domestic and international) scheduled service passengers systemwide, a 3.5 per cent rise from the 897.9 million carried in 2015.
The growth was primarily attributable to a 3.3 per cent rise in domestic traffic to 719 million, although the rate of growth for international traffic was higher at 4 per cent to 209.9 million.
Annual Passengers on all US scheduled airline flights (domestic & international) and foreign airline flights to and from the United States, 2003-2016

US airlines carried 3.3 per cent more passengers on domestic flights and 1.7 per cent more passengers on international flights in 2016, while overseas airlines carried 6.3 per cent more passengers than in 2015.The full data from the US DOT can be found here.
|
2016 Rank |
Carrier |
2016 Enplaned Passengers |
2015 Rank |
Change (%) |
|
1 |
Southwest |
151.7 |
2 |
5.0 |
|
2 |
American* |
144.2 |
1 |
-1.6 |
|
3 |
Delta |
143.1 |
3 |
3.2 |
|
4 |
United |
100.1 |
4 |
5.0 |
|
5 |
JetBlue |
38.2 |
5 |
9.0 |
|
6 |
SkyWest |
31.2 |
6 |
3.7 |
|
7 |
Alaska |
24.4 |
9 |
6.8 |
|
8 |
ExpressJet |
22.2 |
8 |
-14.7 |
|
9 |
Spirit |
21.0 |
10 |
19.1 |
|
10 |
Frontier |
14.8 |
12 |
17.5 |
* American Airlines 2015 passenger number includes 28.256 million passengers reported as US Airways from Jan-Jun 2015.
